Glacier melt: 700,000 km² mapped
Under the coordination of the LEGOS space geophysics and oceanography research laboratory, an international team working with the Theia data hub’s Glaciers scientific expertise consortium has measured changes in the world’s glaciers over 20 years (2000-2019). On average, they lost 267 billion tonnes in mass a year, a cumulative decline of 4%.
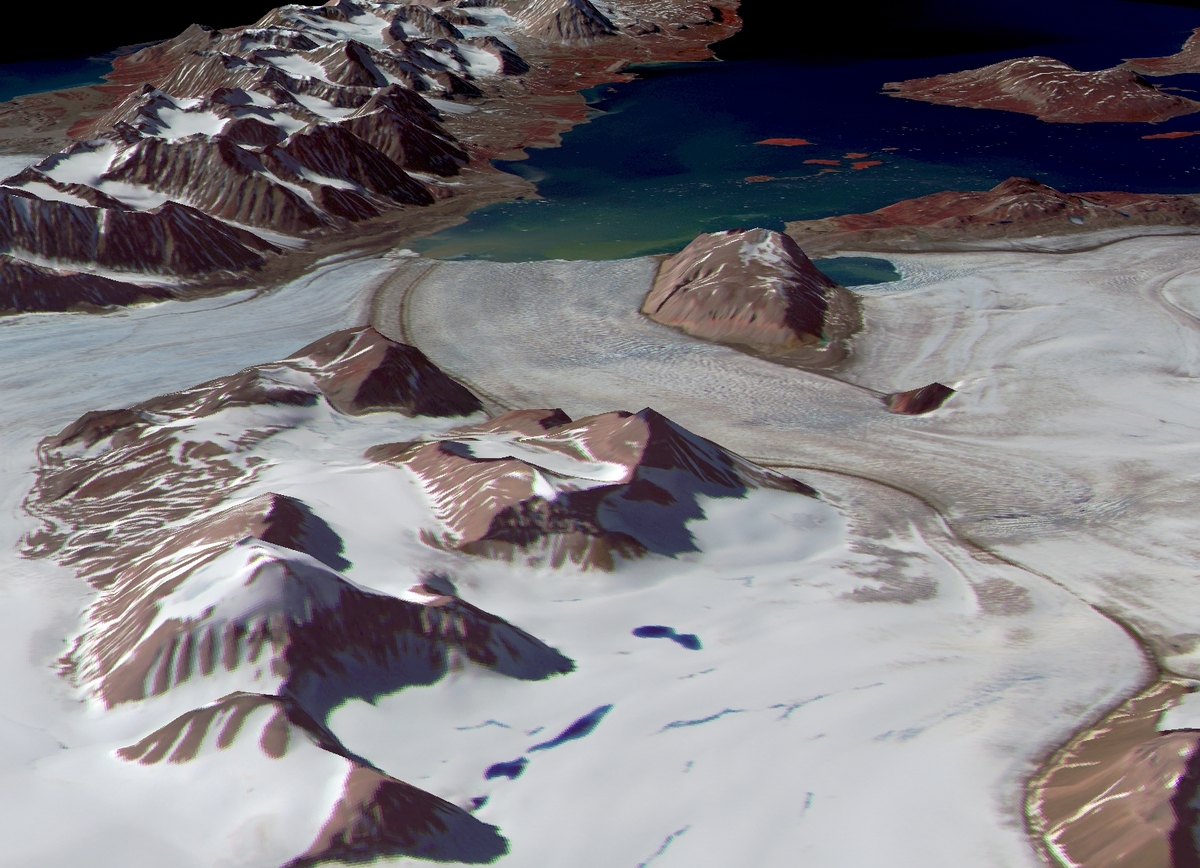
The world’s glaciers—excluding the Greenland and Antarctic ice sheets—cover an area of 700,000 km². That’s a pretty large area, but our knowledge of these glaciers is sketchy at best and many uncertainties remain due to the scarcity of adequate, global observations.
In a recent paper published on 28 February in the review Nature, an international team led by LEGOS glaciologists Romain Hugonnet and Étienne Berthier precisely measured glacier evolution from 500,000 archive satellite images largely untapped until now, acquired by the Japanese ASTER instrument on NASA’s Terra satellite.
Each of the 220,000 recorded glaciers on the surface of the globe outside the ice sheets has its own specific characteristics, but together they have lost 267 gigatonnes per year on average over the last 20 years. This study—the result of eight years of research—marks the first time a team has succeeded in obtaining a synoptic picture of changes in glacier mass over such a long period.
Monitoring regional glacier evolution
Using the Theia data hub’s glacier elevation change product, the science team calculated that glaciers have lost an average mass of 267 ± 16 gigatonnes per year globally since 2000, equivalent to a 21% ± 3% rise in sea level. The product also enabled them to identify an acceleration in mass loss of 48 ± 16 gigatonnes per year per decade, explaining the 6% to 19% acceleration in observed sea level rise. Thinning rates of glaciers outside ice sheet peripheries doubled over the past two decades. Glaciers are currently losing more mass, and at similar or faster acceleration rates, than the Greenland or Antarctic ice sheets taken separately.
Thanks to these new estimates, the study found contrasting glacier fluctuations across regions that agree with the decadal variability in precipitation and temperature. These include a North Atlantic anomaly of decelerated mass loss, a strongly accelerated loss from Alaska and North-western Canada, and the apparent end of the Karakoram anomaly of mass gain up to 2015. These analyses advance understanding of the factors driving glacier change and extend our prediction capabilities for the 21st century. Improved projections will be key to designing adaptive policies for management of water resources and mitigation of the impacts of sea level rise in coastal areas.
This new dataset was validated using data from the ICESat and Ice Bridge missions and from high-resolution elevation difference maps derived from Pleiades and SPOT 6-7 imagery acquired through the DINAMIS programme, as well as other sources. The whole project has been funded for nearly 10 years now by the French space agency CNES through the TOSCA programme.
These data can now be visualized or downloaded from THEIA.
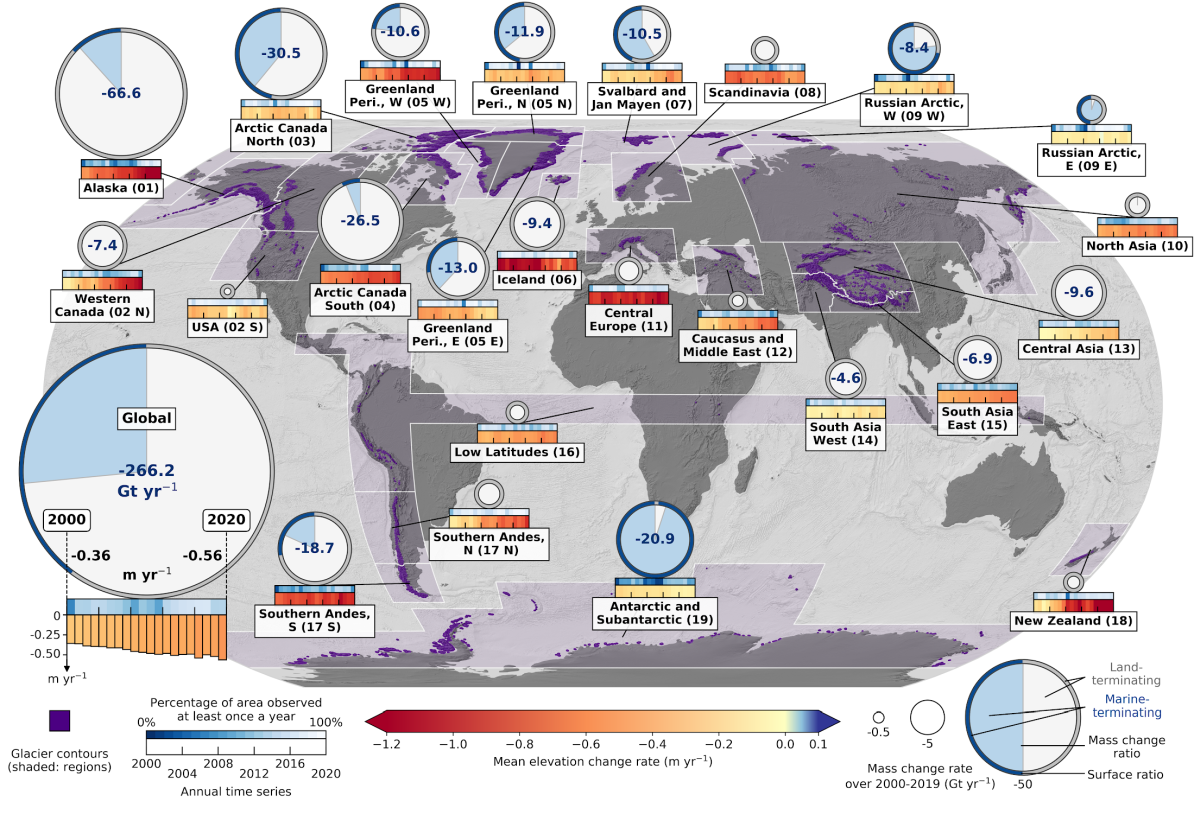
Map of mass loss from main glacier regions between January 2000 and December 2019. The colour timelines illustrate changes over time in each region. Circles distinguish the relative contribution of marine-terminating and land-terminating glaciers. Source: Hugonnet et al., Nature, 2021.
➡️ Learn more about the THEIA data and services hub
Science contacts
Romain Hugonnet (LEGOS): romain.hugonnet@legos.obs-mip.fr
Étienne Berthier (LEGOS): etienne.berthier@legos.obs-mip.fr