
- Atmosphere
- Biodiversité
- Images satellites DINAMIS
- Observation Système Terre
- Ocean
- Surfaces continentales
- FAIR Data et expertise
- International
- Transition écologique
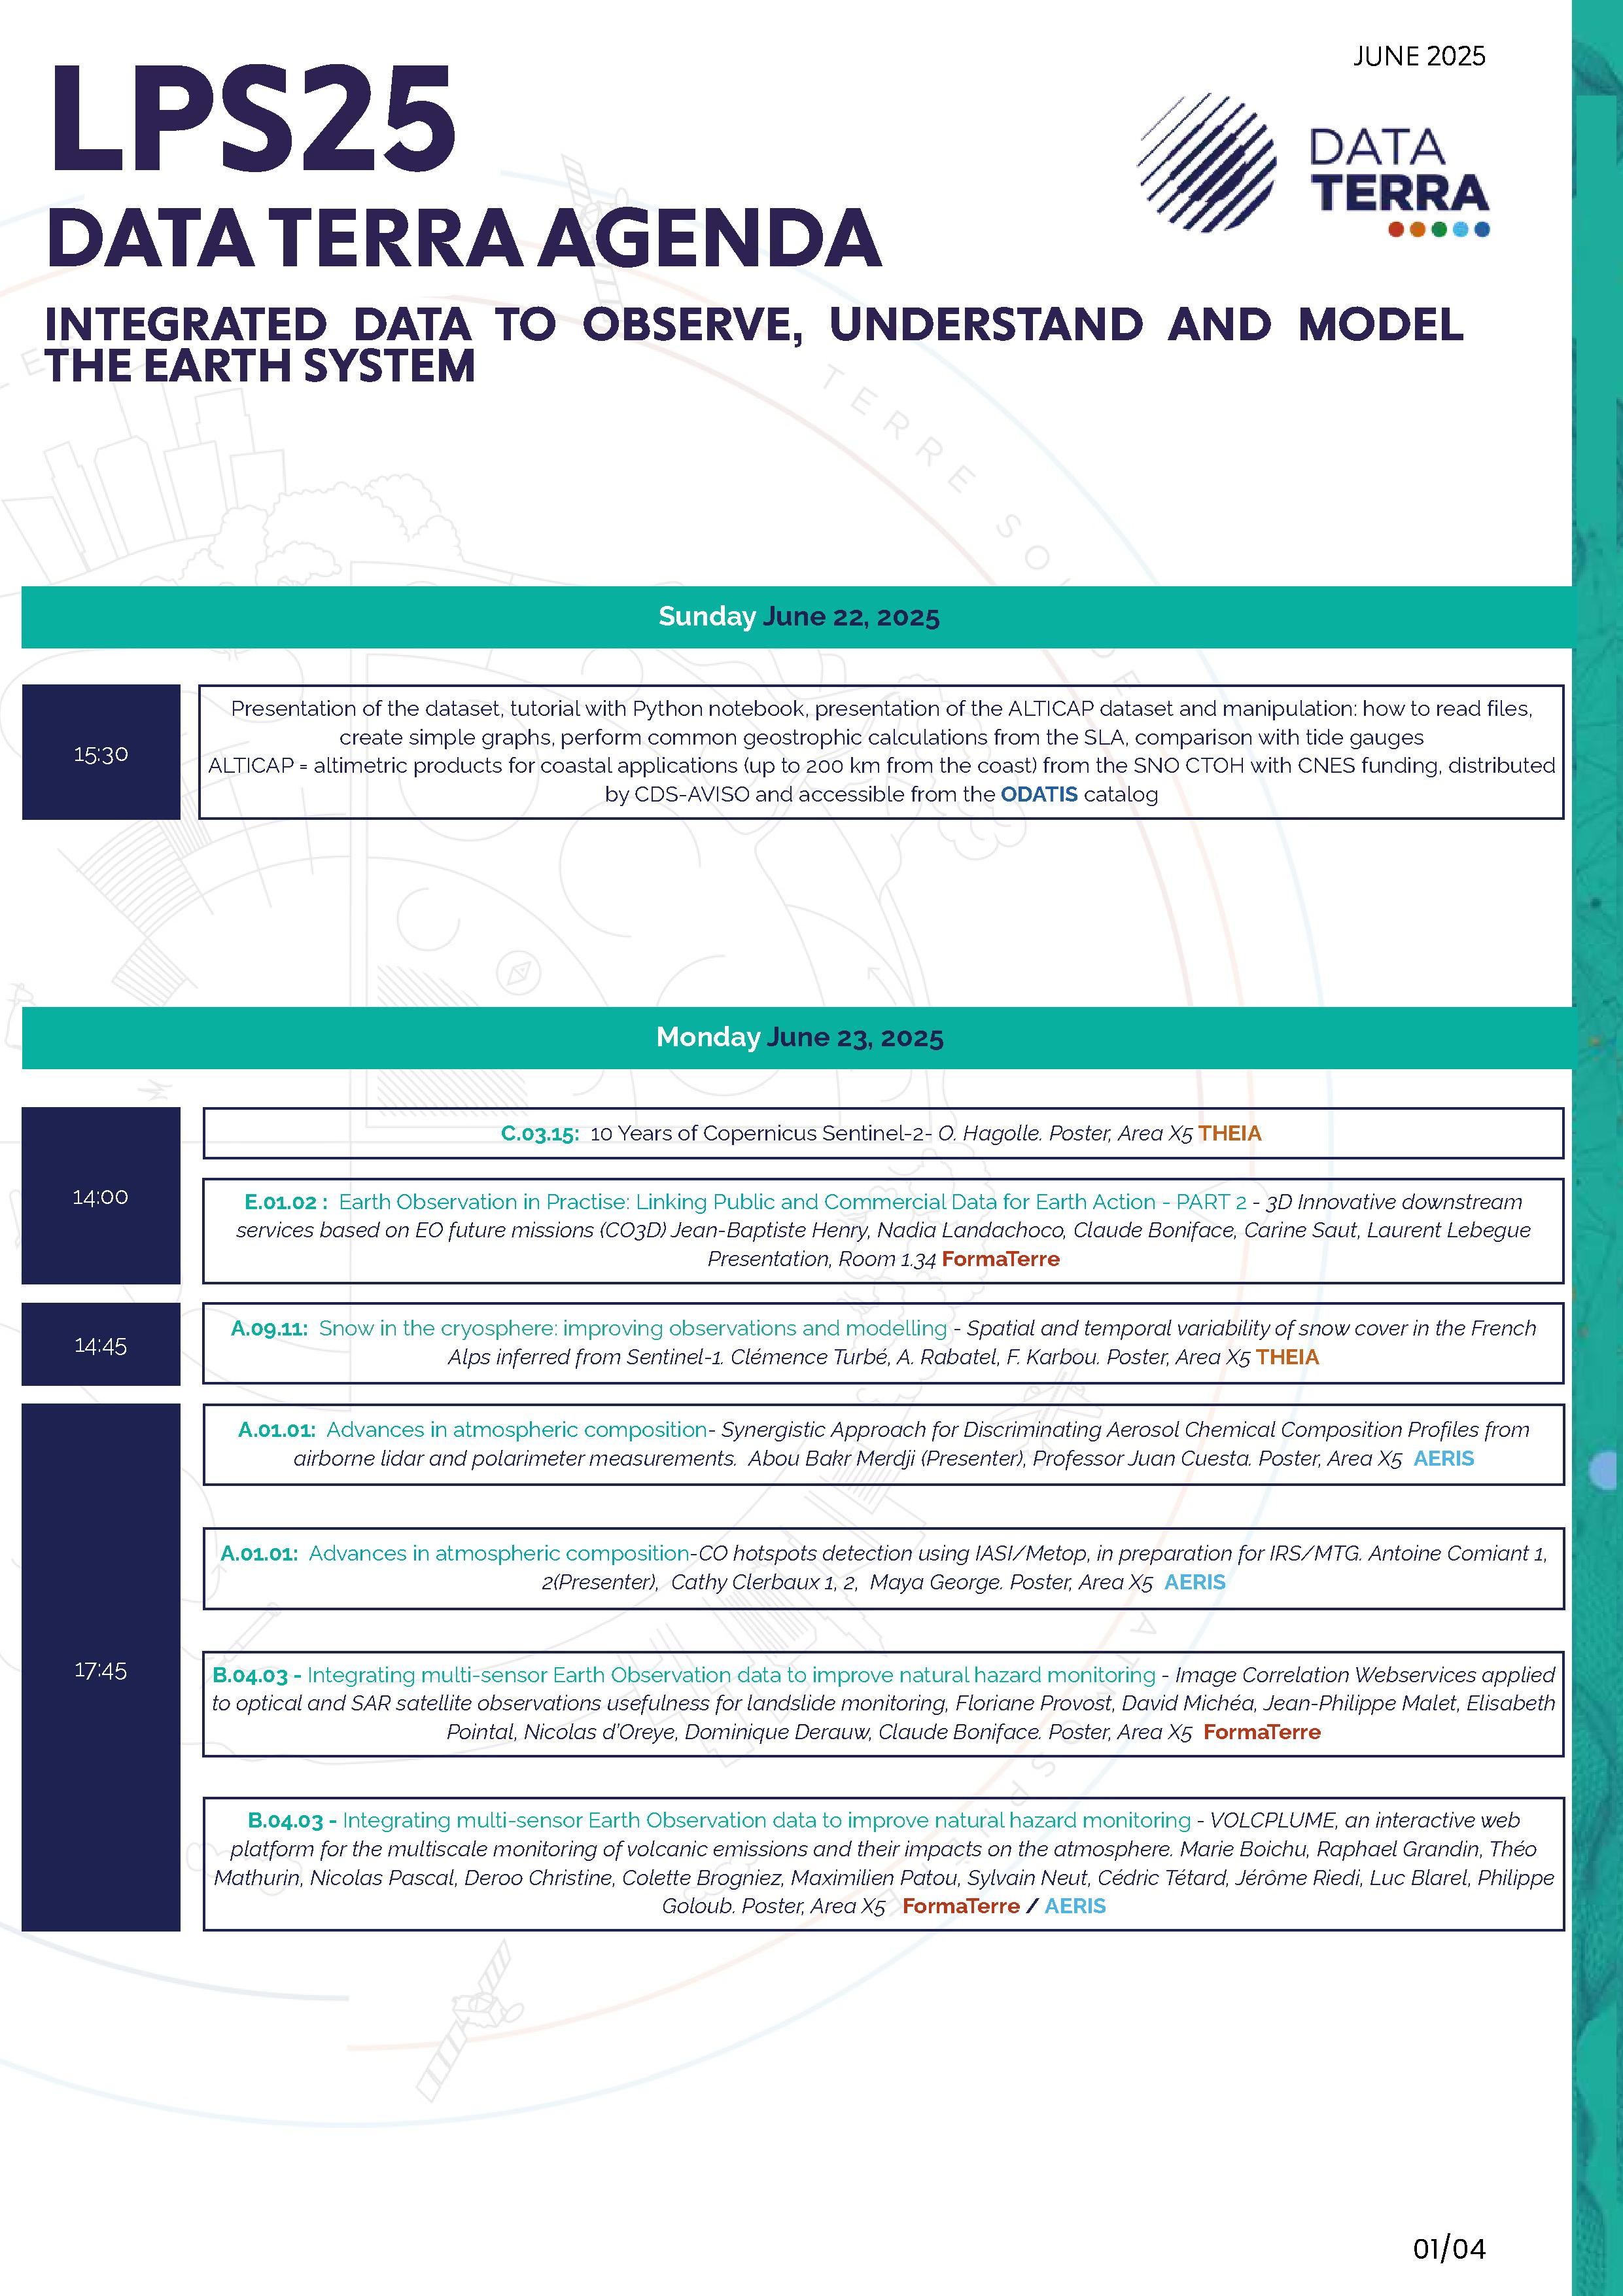
Poster Data Terra EGU 2025
Fichier pdf
Publié le


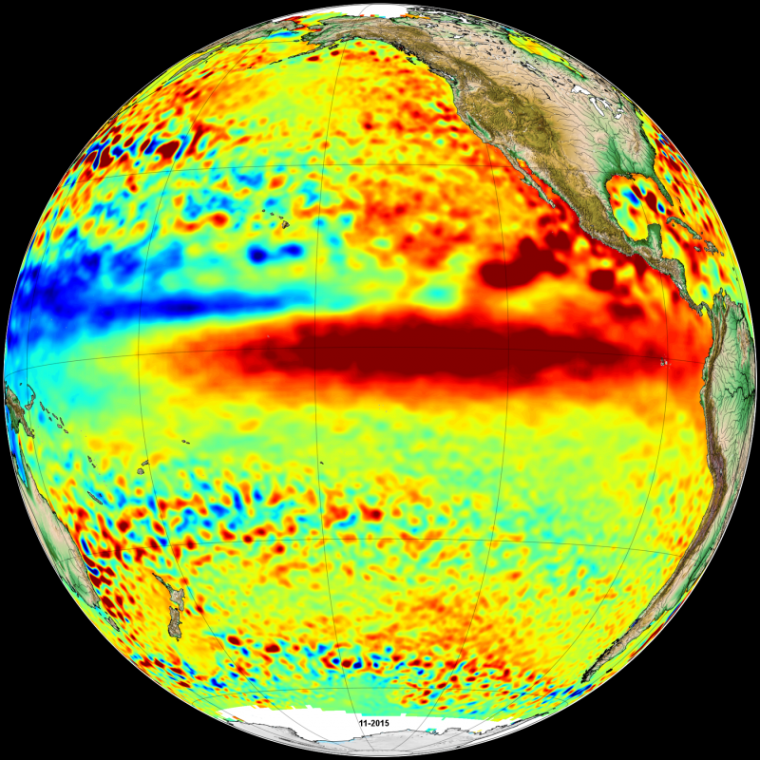
El Niño phenomenon in November 2015
Fichier imageSea level anomalies measured by altimetry satellites, showing positive sea level anomalies in red, indicating a strong El Niño event. Altimetry satellites allow to follow the evolution of the El Niño phenomenon and to measure its level: as early as April 2015, sea level maps show large areas with positive anomalies in the equatorial Pacific of more than 20 centimeters above average. At that same time, surface temperatures were also warmer than normal. During the summer of 2015, this warm water extends into the east-central Pacific Ocean. These temperature and sea level anomalies result in significant heat energy transfers between the ocean and atmosphere, and affect the climate of the entire planet. Credits CMEMS / Ssalto/Duacs / AVISO+.
Publié le
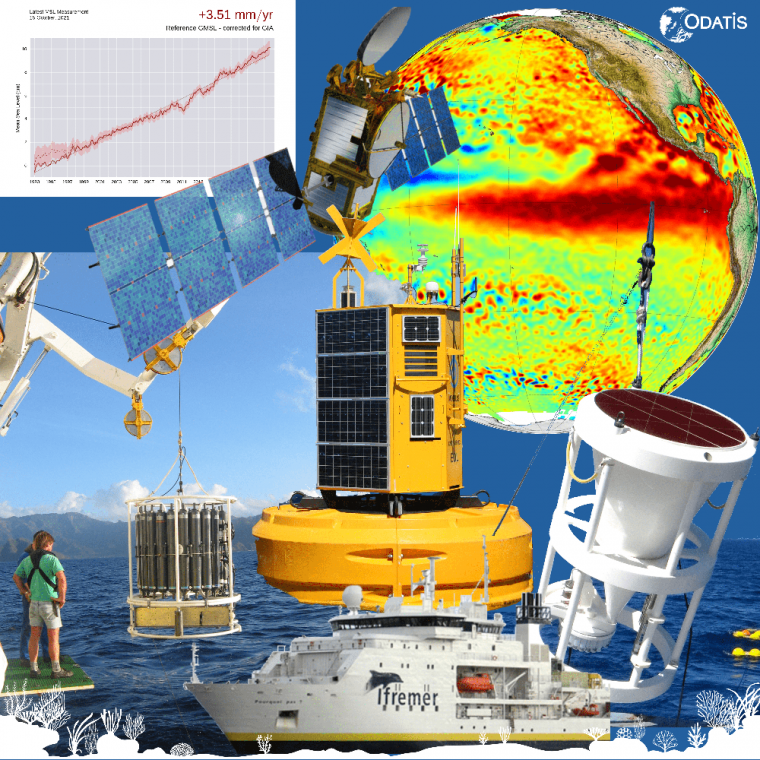
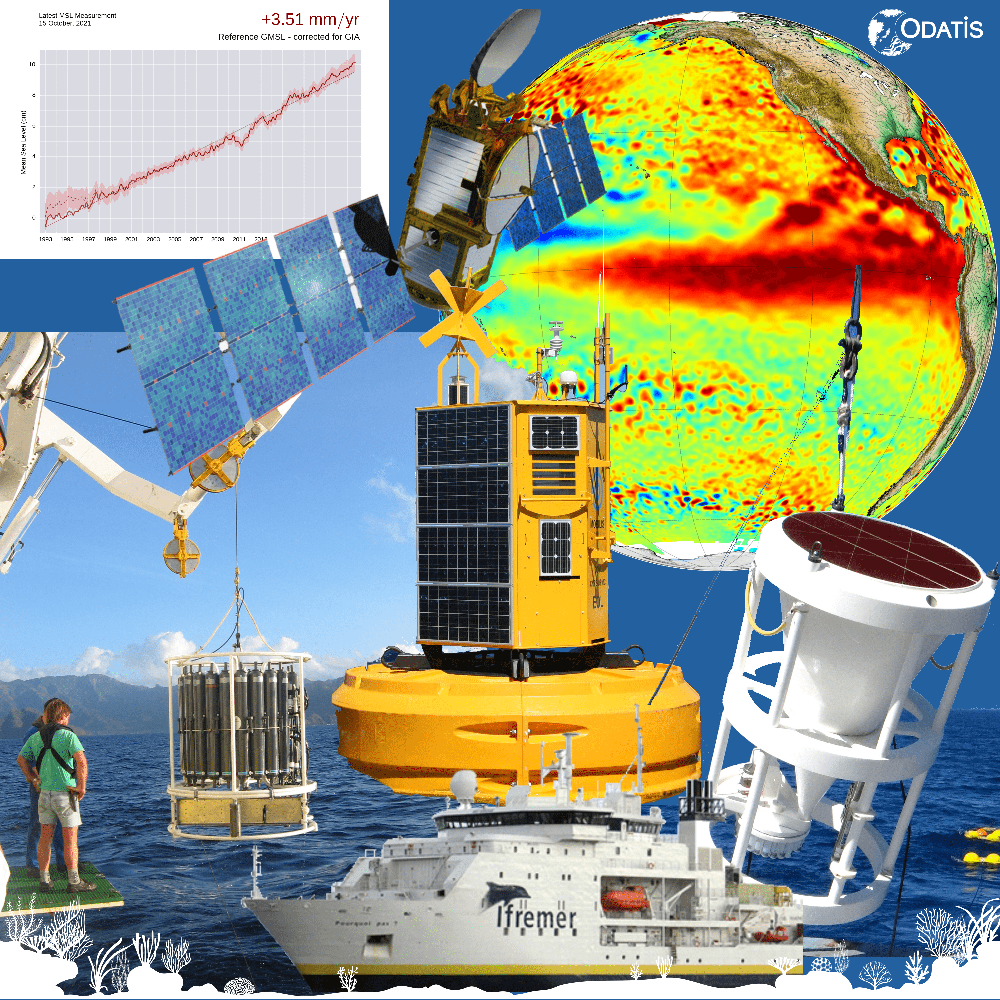
In situ and satellite observation means
Fichier imageLong-term in situ and satellite observations are essential to measure, describe, quantify and understand the ocean in the context of global warming.
Publié le
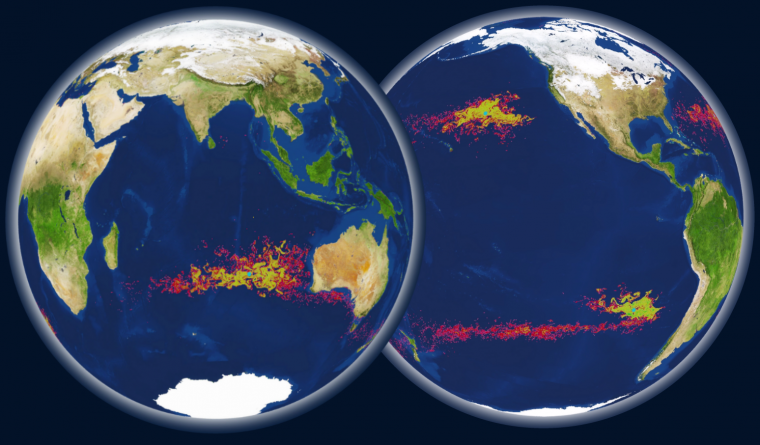
Modeling of particle trajectories
Fichier imageModeling of dispersing and converging particle trajectories simulating floating material at the ocean surface. This model assimilates 29 years [1985-2013] of surface (or sub-surface, at ~0.5 m depth) current data from a reanalysis combining both in situ and satellite observations and takes into account atmospheric forcing via atmospheric reanalyses. A Lagrangian analysis then allows to follow in time the particles along their trajectory, by horizontal advection, under the effect of these currents. Convergence zones within oceanic gyres are observed. Credits C.Maes, Geophysical Research Letters.
Publié le
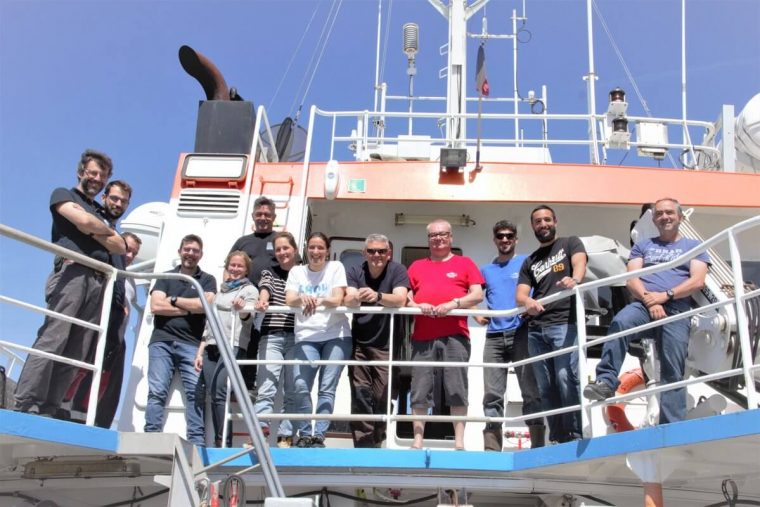
Crew of the FUMSECK sea campaign, in 2019, in the Mediterranean
Fichier imageScientific team and crew of the oceanographic vessel Téthys II, back in the port of La Seyne-sur-Mer at the end of the FUMSECK campaign in May 2019. Its objective is to carry out technological tests, at different levels, of the instruments used to study the processes and three-dimensional dynamics of fine-scale currents (from 0.1 to 100 km for a lifetime of a few days to a few weeks). Credit MIO, Mediterranean Institute of Oceanology.
Publié le
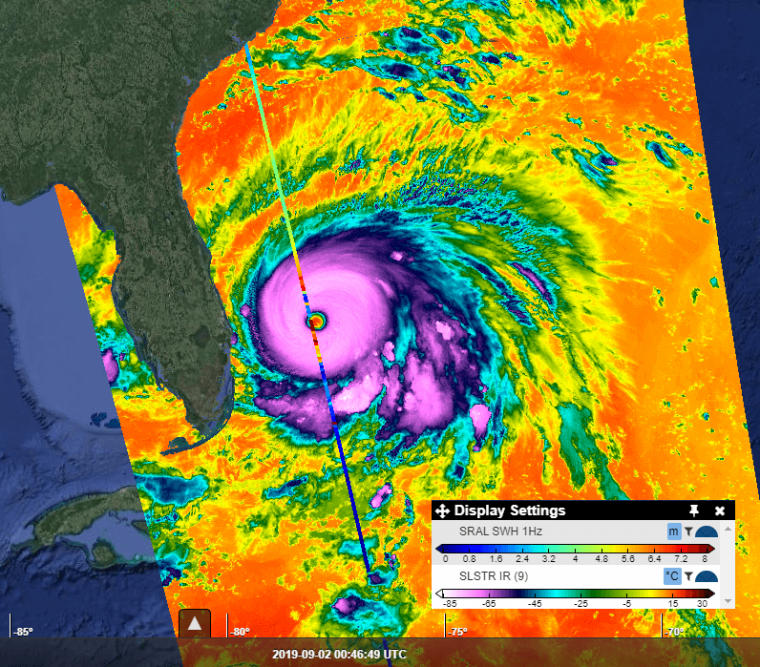
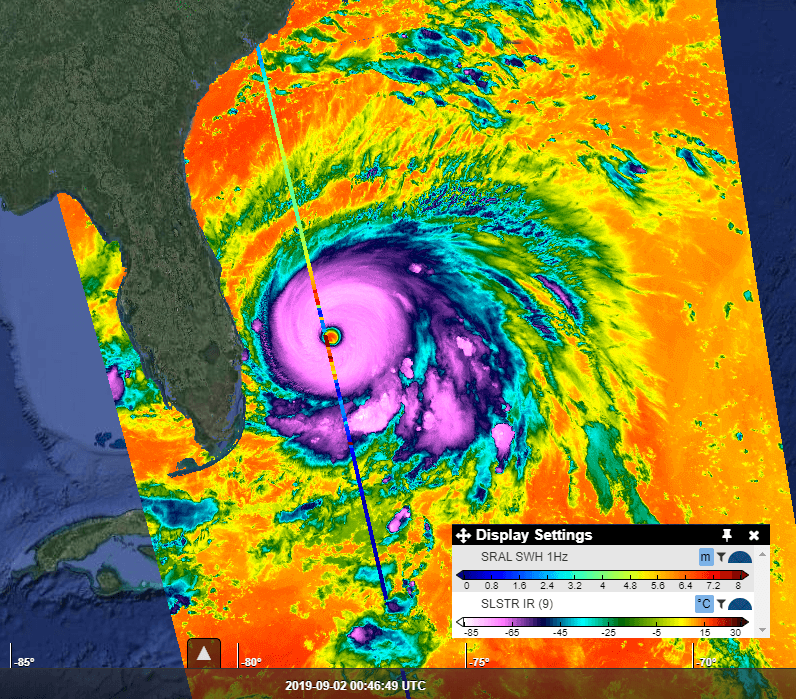
Waves and temperature during the passage of Hurricane Dorian in September 2019 in the Bahamas
Fichier imageSignificant wave height measurements along the track of the Copernicus Sentinel-3A and Sentinel-3B missions superimposed on the surface temperature of the SLSTR IR instruments on 02/09/2019 during the passage of Hurricane Dorian, which severely affected several islands in the Bahamas. These figures are obtained from the S3View visualization tool, developed by OceanDataLab, for ESA.
Publié le
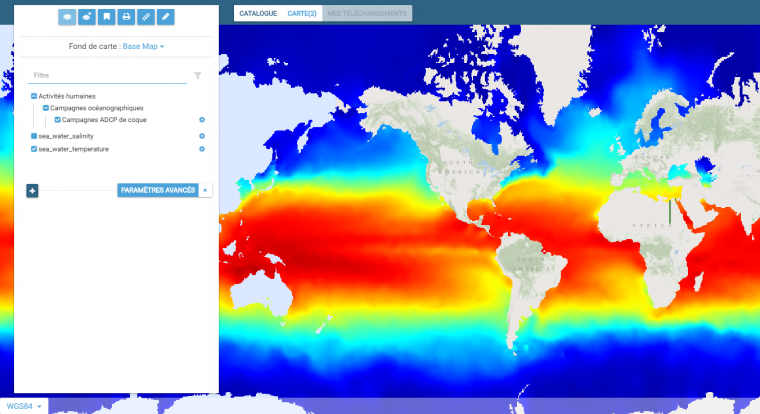
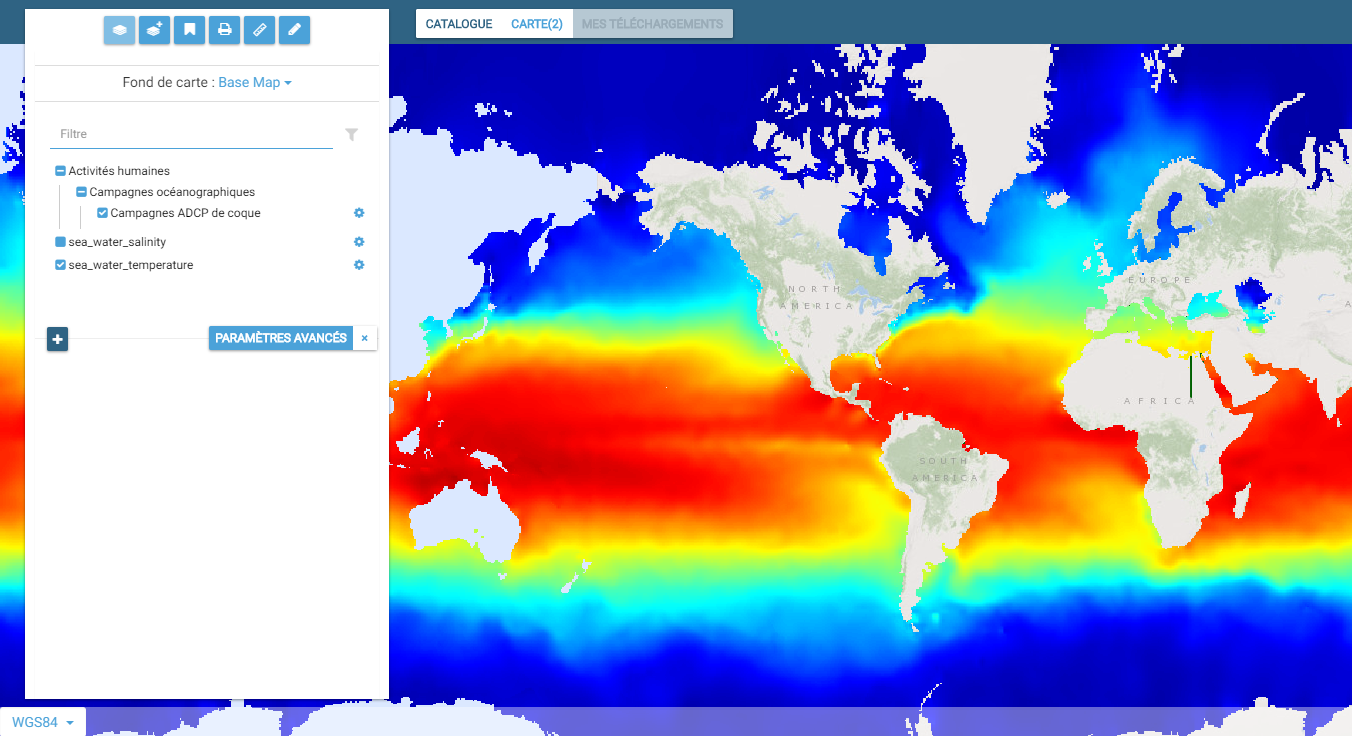
Ocean temperature
Fichier imageMonthly temperature map produced by the ISAS-13 analysis, calculated for the period 2004-2014. These data are visible from the ODATIS catalog through this interactive interface. Credits ODATIS/SEXTANT
Publié le

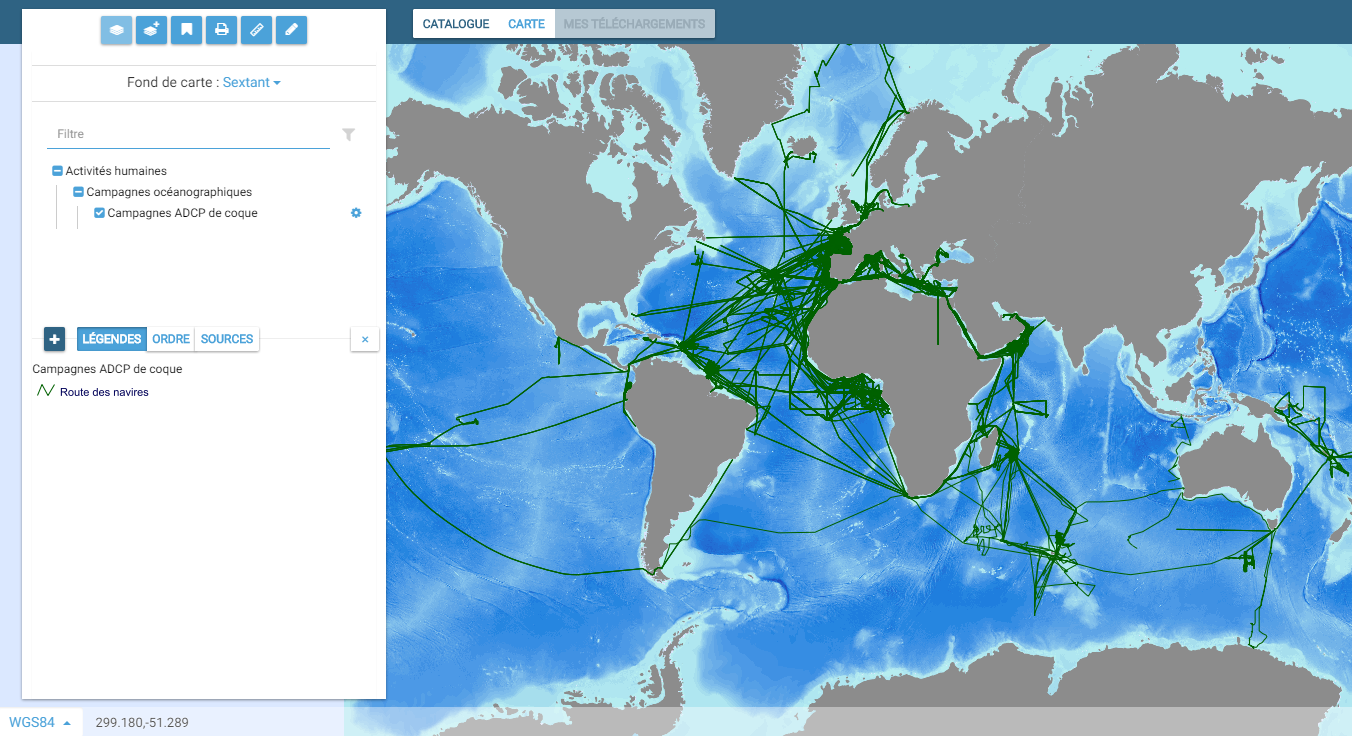
Cartographic interface of the ODATIS catalog with the route of oceanographic vessels
Fichier imageCurrentometry data measured continuously by a hull ADCP (Acoustic Doppler Current Profiler) along the trajectories of oceanographic vessels from IFREMER, Shom and IRD. The data are controlled and validated by the CDS-IS-SISMER of the ODATIS ocean pole. These data are visible from the ODATIS catalog through this interactive interface. Credits ODATIS/SEXTANT
Publié le
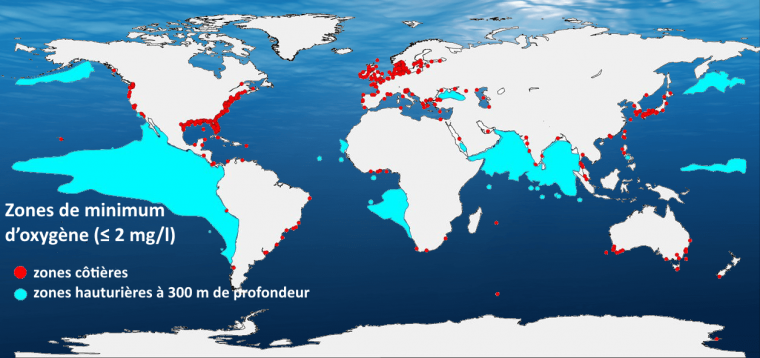
Oxygen minimum zones in the ocean
Fichier imageOxygen Minimum Zones (OMZ); in red, coastal sites where nutrient loading has caused oxygen content to decline to concentrations < 2 mg/l and, in blue, oxygen minimum zones at 300 m depth. The oxygen cycle in the oceans provides half of the available air supply to all aerobic organisms on our planet. In the ocean, the sources that produce oxygen are mostly represented by phytoplankton and photosynthetic bacteria like cyanobacteria. Through this photosynthetic mechanism, the oxygen cycle interacts with the carbon cycle. Credit: illustration adapted from the GO2NE working group. Data from World Ocean Atlas 2013 and provided by R. J. Diaz.
Publié le

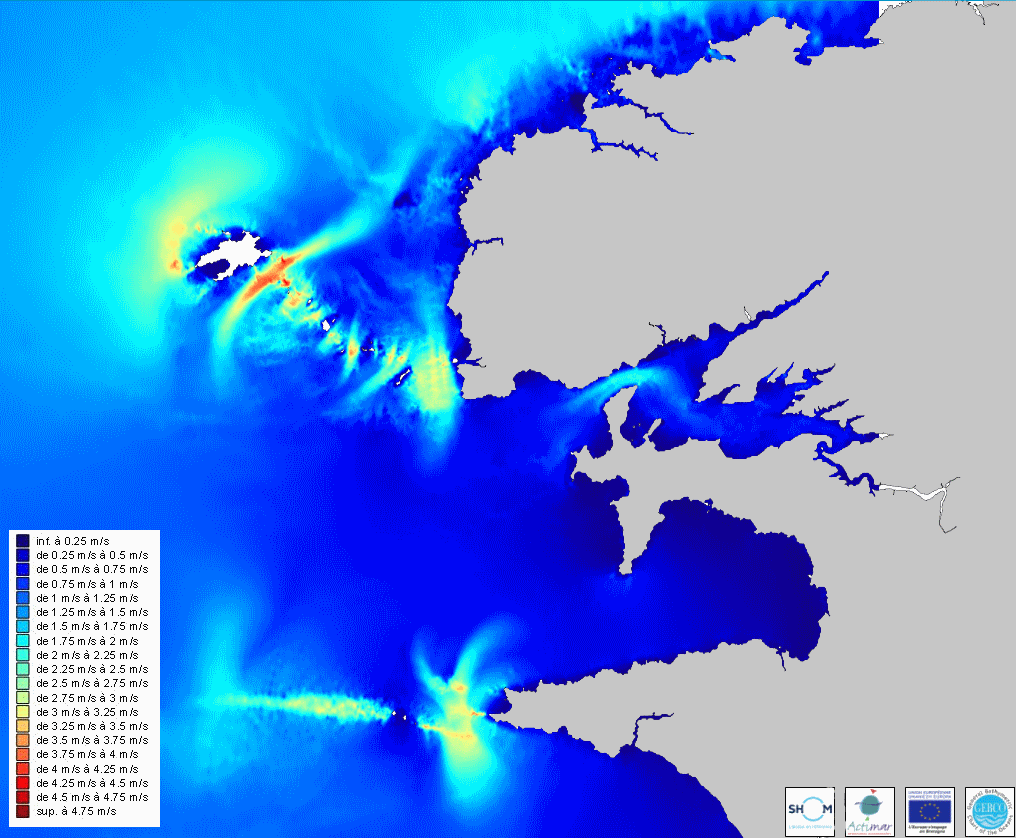
3D tidal currents – ODATIS
Fichier imageCarte de courants de marée de la zone "Rade de Brest - Iroise" issue de l’exploitation d'un modèle hydrodynamique haute résolution en 3 dimensions et représentant les courants de marée pour trois immersions (surface, mi-profondeur, fond), sur un cycle de marée échantillonné toutes les heures. Ce jeu de données est proposé par le CDS-IS-Shom du pôle océan ODATIS. Crédits Shom
Publié le
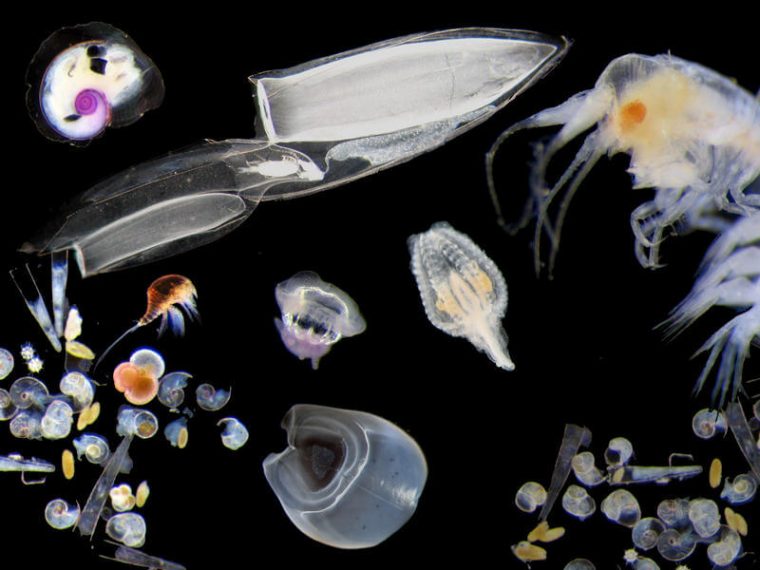
Richness of zooplankton – ODATIS
Fichier imageThe RadeZOO collections are preserved at the IMEV (Institut de la Mer de Villefranche-sur-Mer) which is one of the data and services center of the ODATIS ocean cluster and constitutes one of the largest zooplankton image databases. Abundance, size and biomass of zooplankton are estimated after collection by surface-bottom nets and processing of the samples by different high-throughput imaging instruments. Credits IMEV.
Publié le

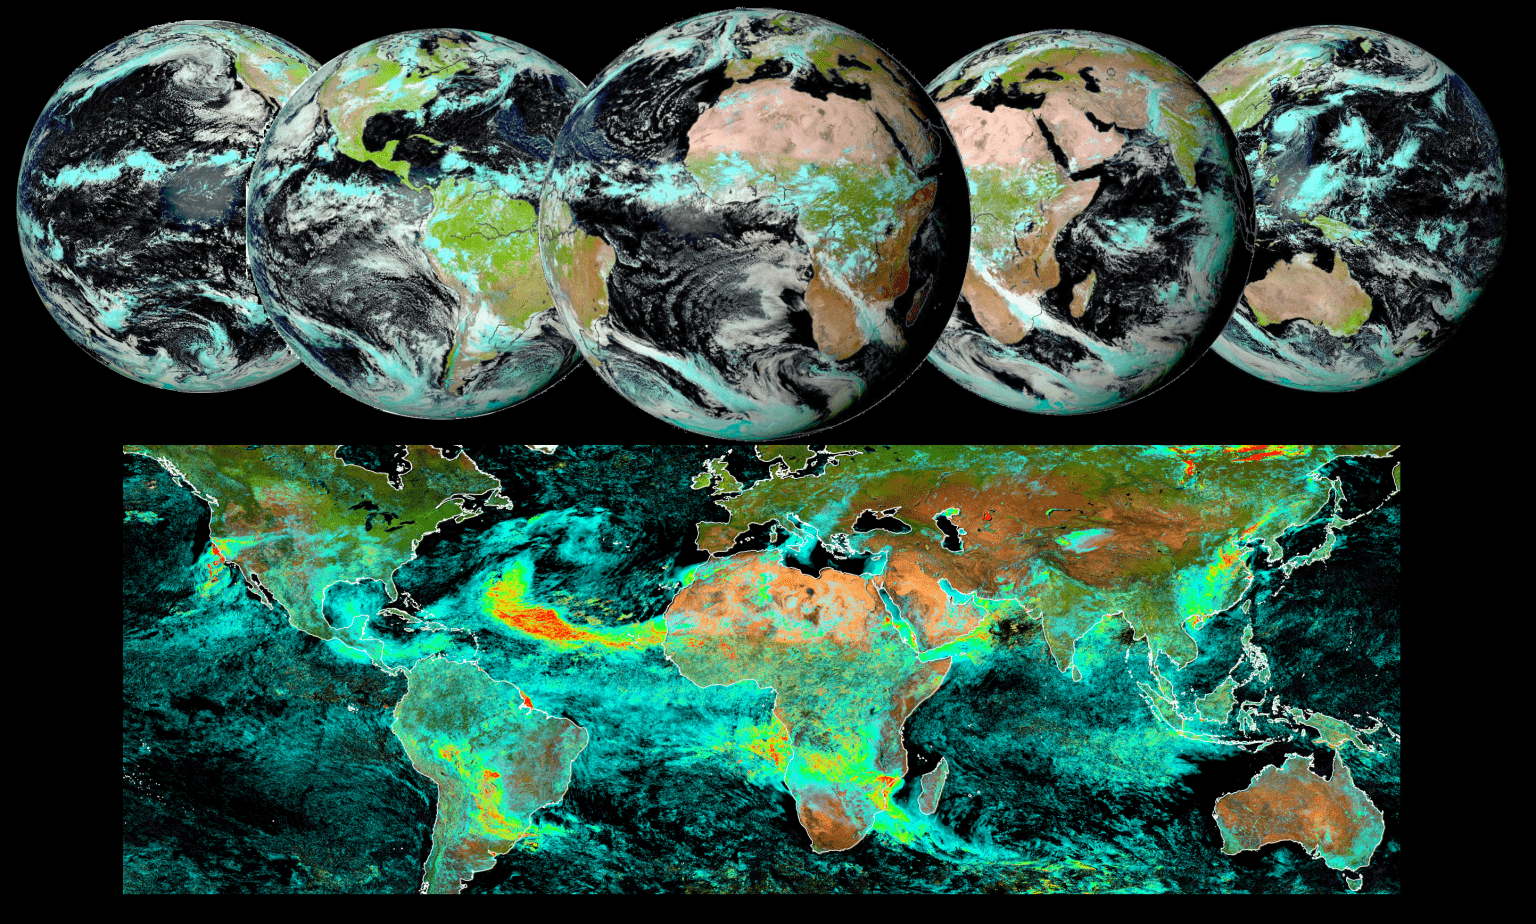
AERUS – GEO
Fichier imageOver past years CNRM has developed with support from AERIS/ICARE the AERUS-GEO suite of Aerosols and Surface properties products (https://www.icare.univ-lille.fr/projects/user-driven-projects/aerus-geo/). Initially aimed at providing a daily averaged Aerosol Optical Depth (AOD) from SEVIRI sensors aboard the MSG satelliteseries, the project is now about to provide retrievals of aerosol properties at 15-min intervals thanks to the new i-AERUS-GEO algorithm (currently under validation). Also, thanks to the GEO archive maintained at AERIS/ICARE we are currently developing a full GEO-ring AERUS-GEO product whereby merging the observations of imagers on five geostationary platforms (MSG-0°, MSG-41,5°E, HIMAWARI, GOES-E and GOES-W) we can derive aerosol properties over the quasi-global zone covered by meteorological operational geostationary satellites. We present here a first snapshot of the product currently under development. The image below illustrates the five GEO imagers used for the product and presents the daily average AOD obtained for August 31, 2020 superimposed on a false color composite image derived from the surface albedo derived by AERUS-GEO for the corresponding period.
Publié le
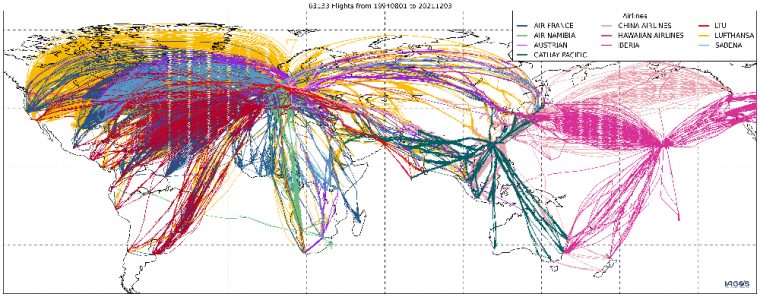
IAGOS – AERIS
Fichier imageIAGOS is an Observation Service labelled by CNRS-INSU since 1994 and a CNRS Research Infrastructure since 2009. IAGOS is the continuation of the MOZAIC program (Measurements of OZone, water vapour, carbon monoxide and nitrogen oxides by in-service AIrbus airCraft) and integrates the observations of the CARIBIC (Global Atmospheric Composition and Climate Change Research) project.
Publié le

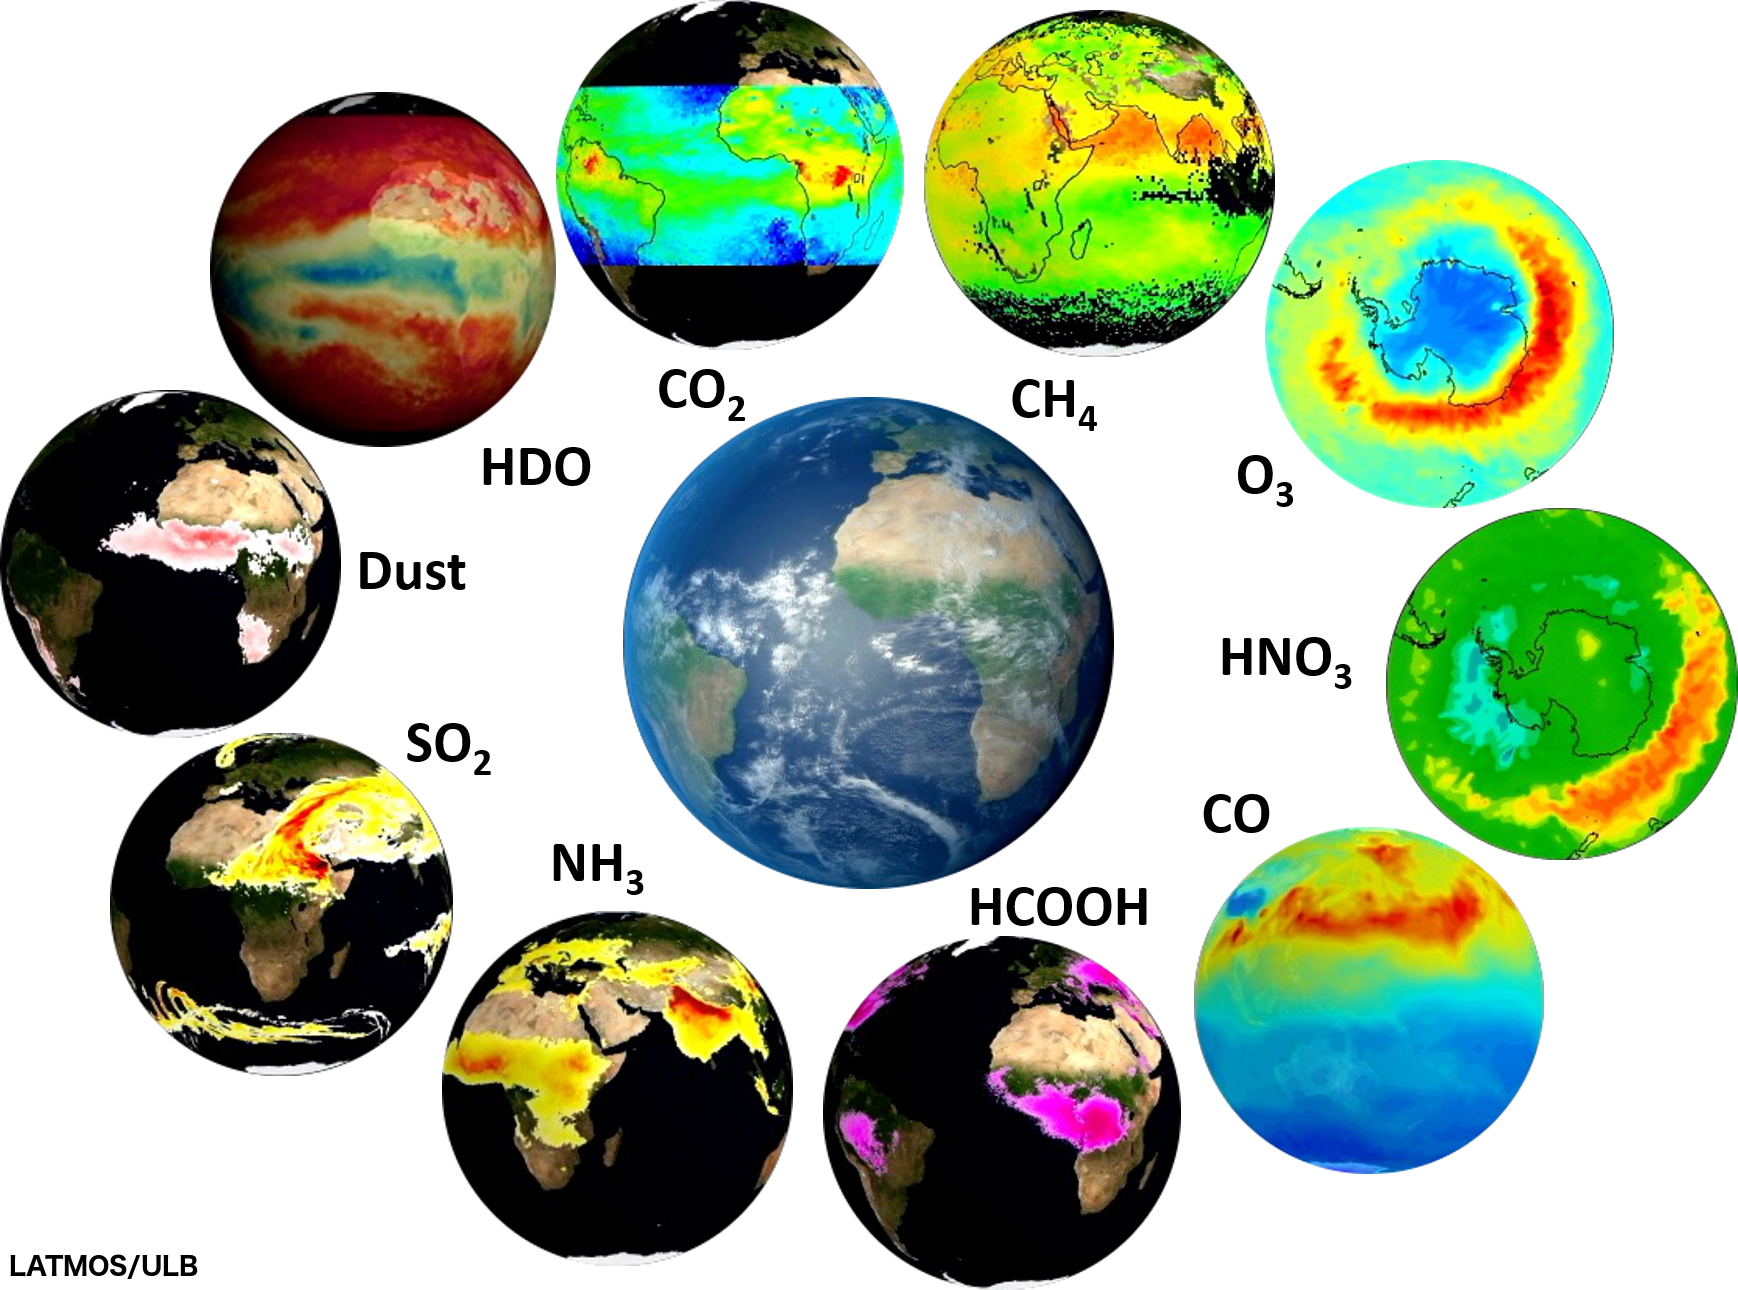
IASI, un allié spatial pour étudier atmosphère, météo et climat – AERIS
Fichier imageSince 2006, the IASI infrared spectrometer has been installed on several weather satellites orbiting the Earth. By receiving the infrared radiation emitted by our planet after it passes through the atmosphere, it allows scientists to deduce the characteristics and composition of the atmosphere over the entire globe. These data are used to improve weather forecasts, study climate change, analyze the effectiveness of regulations aimed at limiting it, and identify certain events such as volcanic eruptions or forest fires. The fifth IASI conference, which takes place from December 6 to 10, 2021, allows scientists to share and discuss the latest results obtained with this instrument.
Publié le

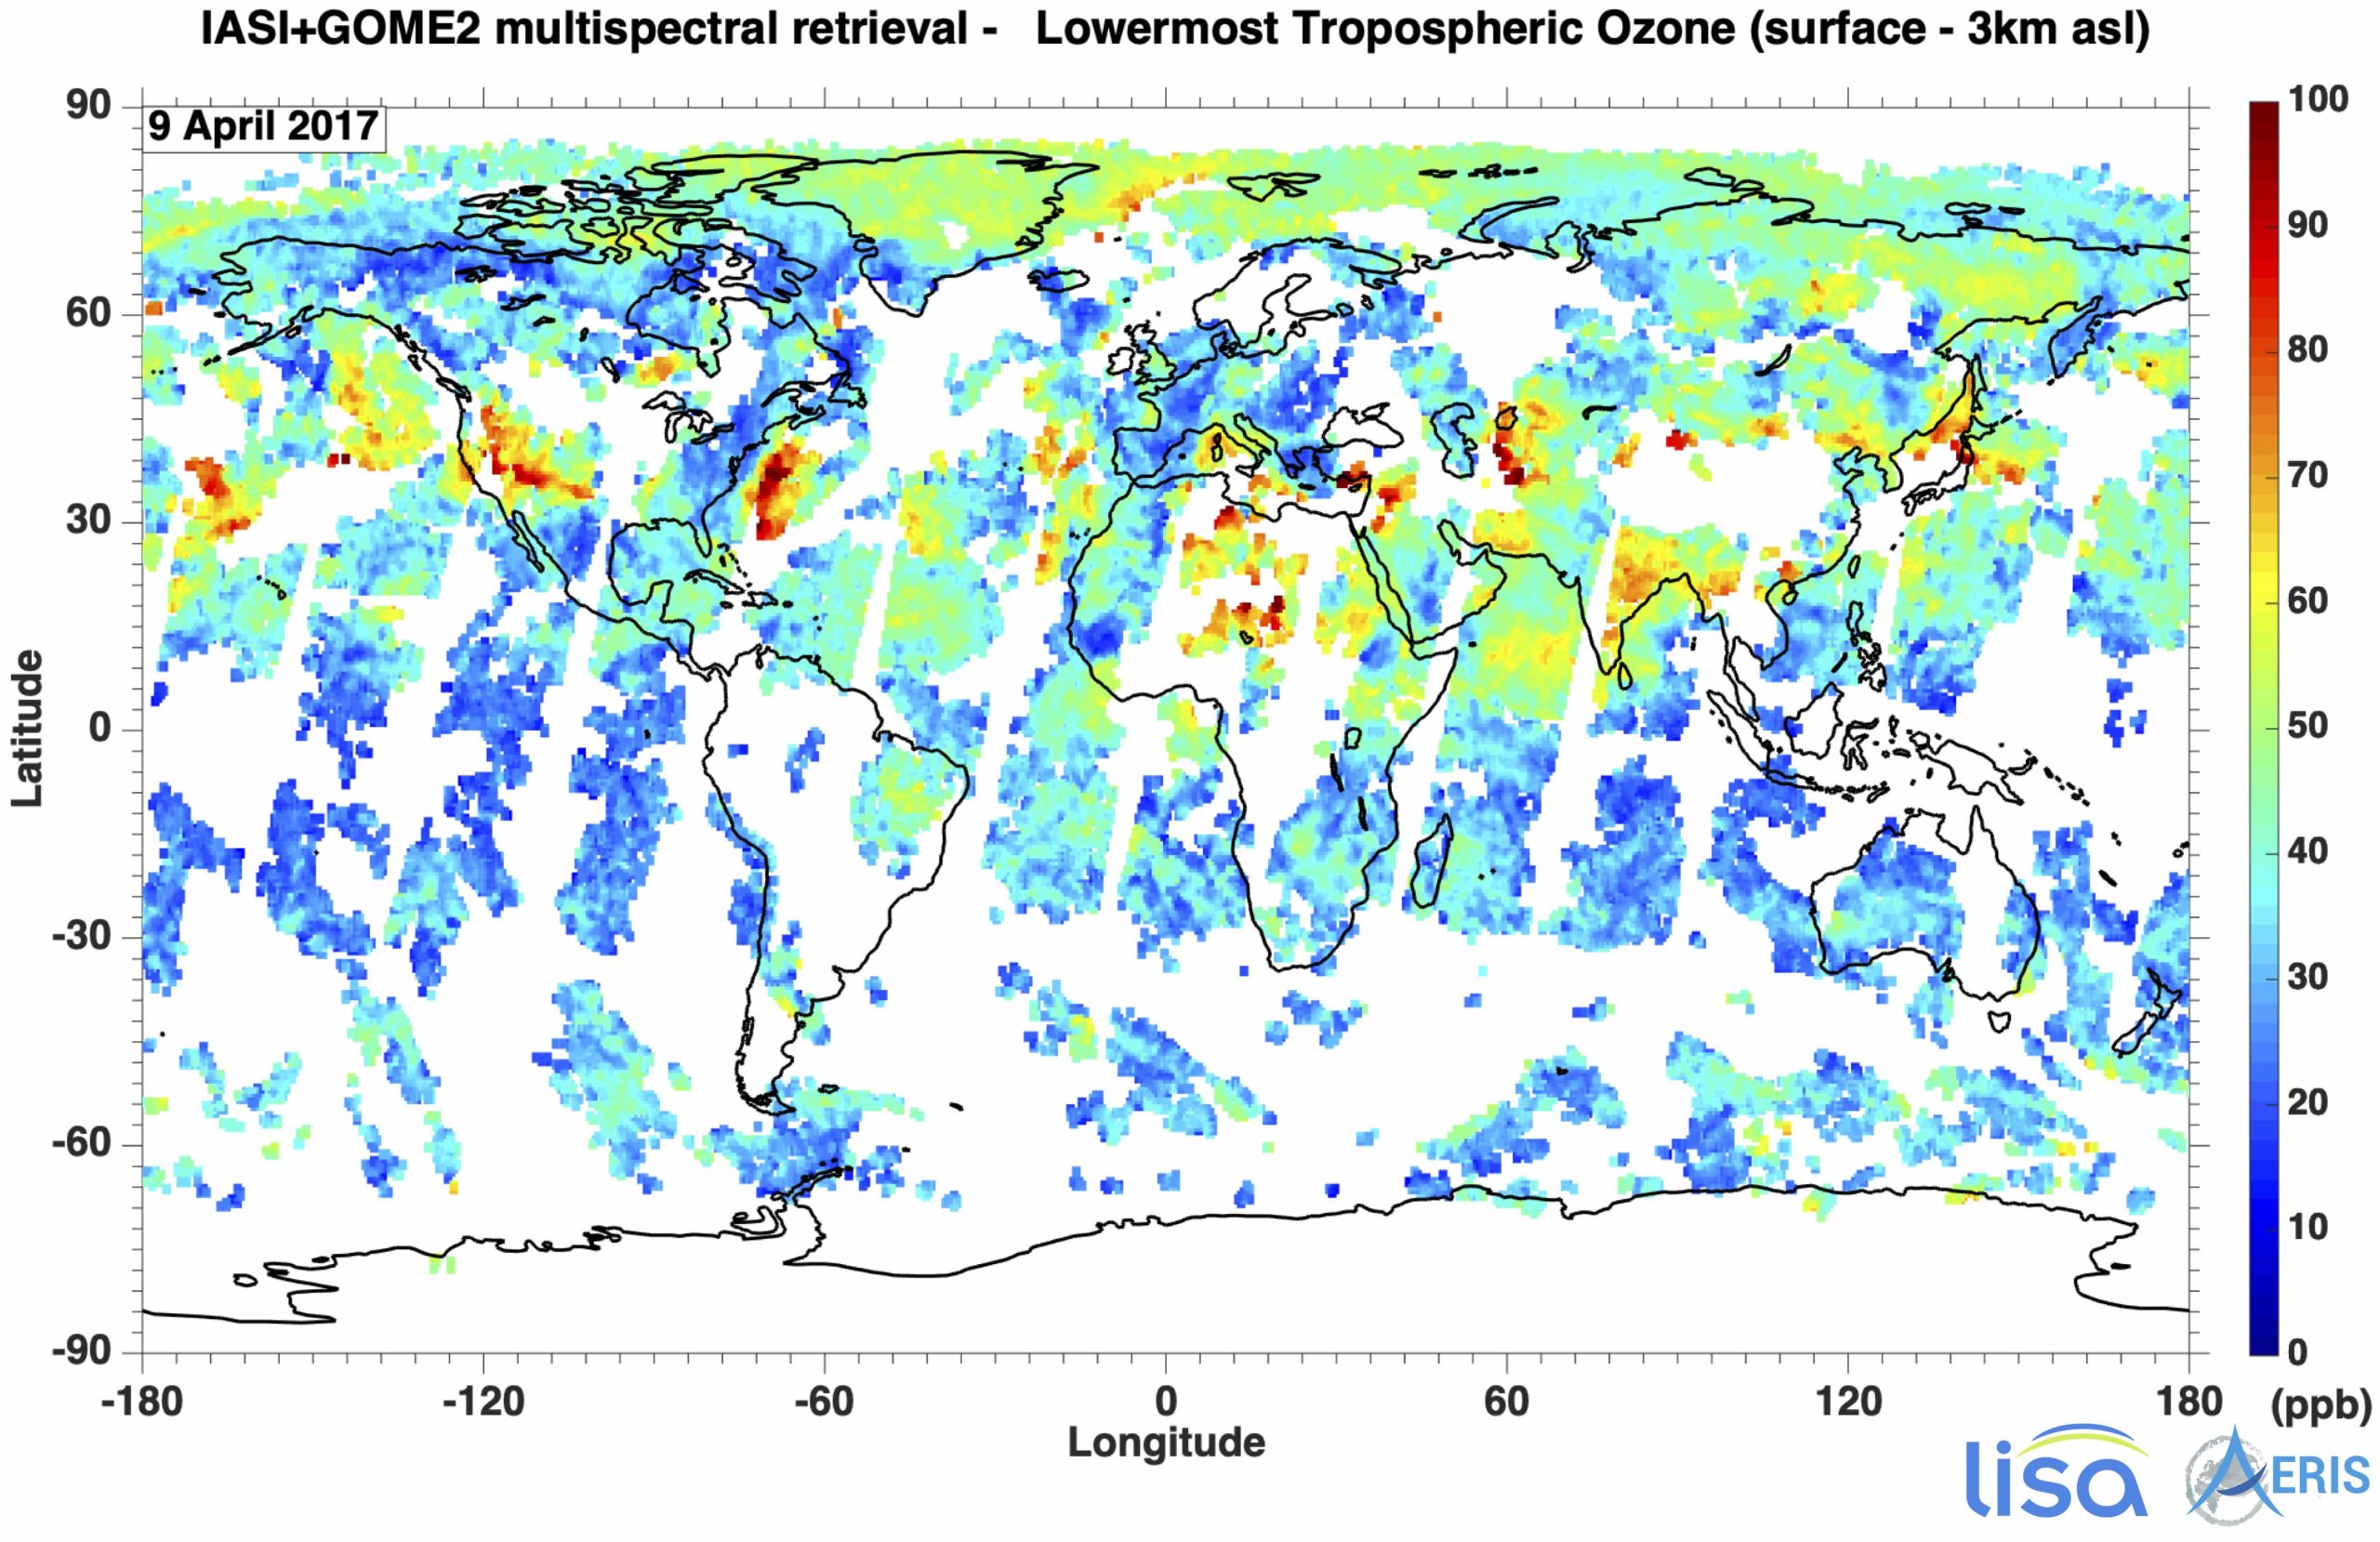
IASI+GOME2: production of ozone data from multi-spectral observations
Fichier imageLevel 2 ozone data from IASI + GOME2 multi-spectral observations are produced on a continuous basis by the AERIS/ESPRI Data and Services Center. The data files will be made available daily in NetCDF format; they will provide vertical ozone profiles from the surface to more than 60 km altitude, partial ozone columns (including the lower troposphere), averaging kernels, error estimates, temperature and pressure profiles, surface temperature, cloud fractions and quality flags.
Publié le