THE EXTENT OF THE DROUGHT IN FRANCE MADE VISIBLE BY THE THEIA HUB THANKS TO SATELLITES DATA
High definition satellite images that cover France and the world are obtained, for the most part, with the Sentinel, Spot and Pléiades satellites. They are systematically processed by expert satellite data researchers in order to analyze them and allow them to be used efficiently by non-specialists. Researchers rely on the images provided by satellites to design products that can feed innovative tools and allow land managers to have all the information in hand to make decisions in the face of environmental hazards.
As of August 4, most French departments (93 out of 96) are still facing restrictions on the use of water. 66 are on high alert and many communities are finding it difficult to supply the necessary structures with drinking water. This crisis situation is even more dramatic than the one that took place in 2020. Various Theia products using Sentinel satellite images, whose high repetitiveness is well suited to monitoring such phenomena, make it possible to document the extent of this crisis.
When France turns yellow in June
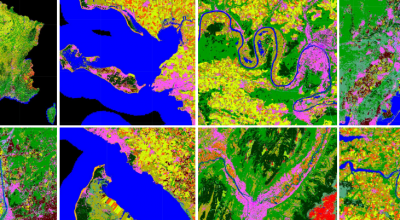
CESBIO, in collaboration with CNES and the THEIA cluster of DATA TERRA, produces series of monthly Sentinel image mosaics which show, in particular, the evolution of drought in France between 2017 and 2022.
These image mosaics can be viewed and compared from the maps.theia-land.fr cartographic server. It presents the available data in a very accessible way and allows everyone to explore all areas of France. The Sentinel-2 surface reflectance series are produced in near real time at CNES for THEIA, at 10 m resolution, with a time lag of about 1 month to access them on site. Supported by various cooperation programs, production has expanded from year to year and now covers the countries bordering France (Belgium, Spain, Italy) as well as the Maghreb and part of the Sahel.
The comparison of data between June 2021 and June 2022 shows that the vegetation lacked water in different French regions as early as June, well before the drought situation now observed.
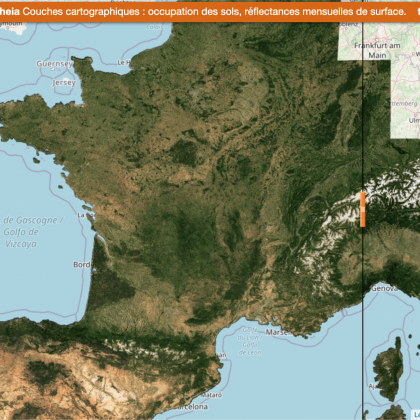
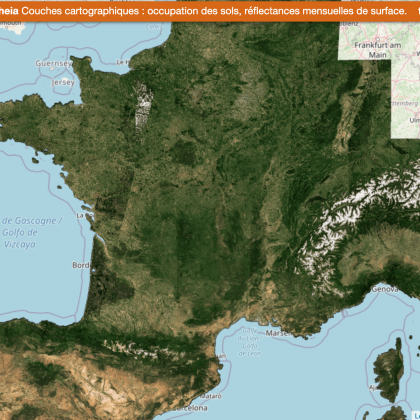
Cartographic layers: land use, monthly surface reflectances. Comparison June 2022 – June 2021
When the soil dries up
Reflectance data is not an indicator of drought. Such indicators are currently being developed within the Theia cluster. The cluster is already producing, in collaboration with INRAE this time, for a series of sites in Europe and around the Mediterranean basin, from Sentinel images (1 and 2), a product for monitoring the humidity at very high resolution (plot scale) and very high repeatability (1 map every 6 days).
Here again, the available maps allow temporal comparisons, documenting all the singularity of the summer of 2022.
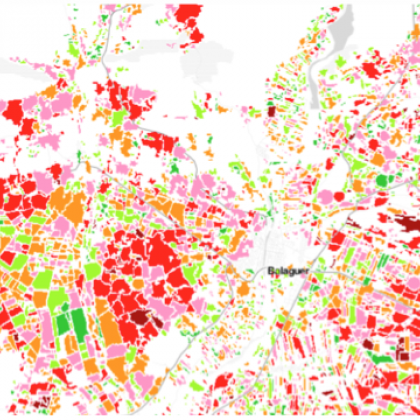
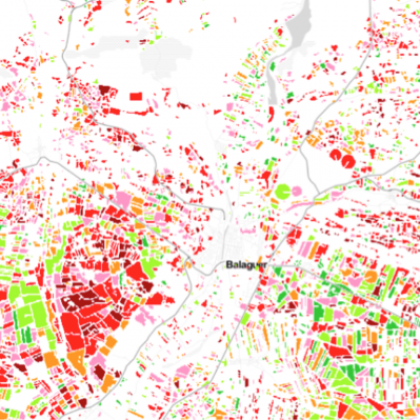
Catalonia, we observe that the region is drier between June 3, 2022 and June 3, 2021
The data and products of tomorrow
Other hydrology monitoring products using Sentinel data are available or under development. But the Theia pole is already preparing for the imminent arrival of SWOT satellite data offering researchers unprecedented altimetry measurements.
This research mission proposed by NASA aims to bring together the needs of the hydrological and oceanographic communities in a single satellite and on a planetary scale. SWOT wants to respond to issues related to water management. Supported by the Future Investment Program, CNES has set up the downstream SWOT program to prepare water stakeholders for the arrival of future SWOT satellite data by the end of 2022. Future SWOT satellite data will make it possible to support research activities in the various Theia CES: land use, water quality and heights, snow-covered surfaces, water surfaces, etc.
Eventually, all data and all products from space concerning water management will be accessible in a single access point and integrated into Theia.
To learn more :


